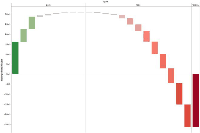
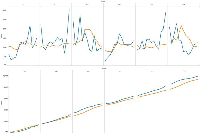
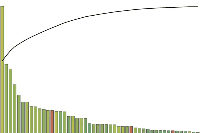
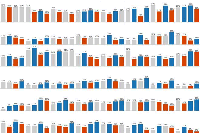
 Many consumer goods products are sold in cases or multi-pack configurations. For example, a multi-pack of beer might be composed of a 6 or 12 pack while a case of screws might come 12 or 100 packs per case. Analyzing performance across multiple package/case configurations and understanding the performance at the case/package level (wholesale selling product) and unit level (individual items inside), is challenging, but the Wedding Cake chart is a great way to understand and visualize this level of detail.
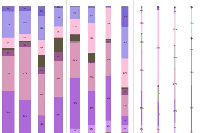
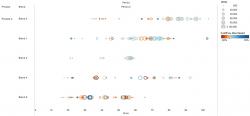 Benefits of Product Mix Analysis: This bead necklace chart provides detailed and actionable insights to better understand the mix of each of the brands/retailers (price distribution) for a specific product hierarchy (SKU in this case), what are the top performing SKUs (with more sales), and if their sales are decreasing or increasing.
Future Advanced Visualizations
 |
 |
 |
 |
 |
 |
 |
 |
 |
 |
Submit Your Own
Want so submit your own advanced visualization? Contact us.
|
|
|
|
|
|
|
|
|
|
|
|
|
|
Want so submit your own advanced visualization? Contact us.