November 7, 2012
Tips & Trick Presented by ConsumerGoodsAnalytics.com at the 2012 Tableau Customer Conference in San Diego
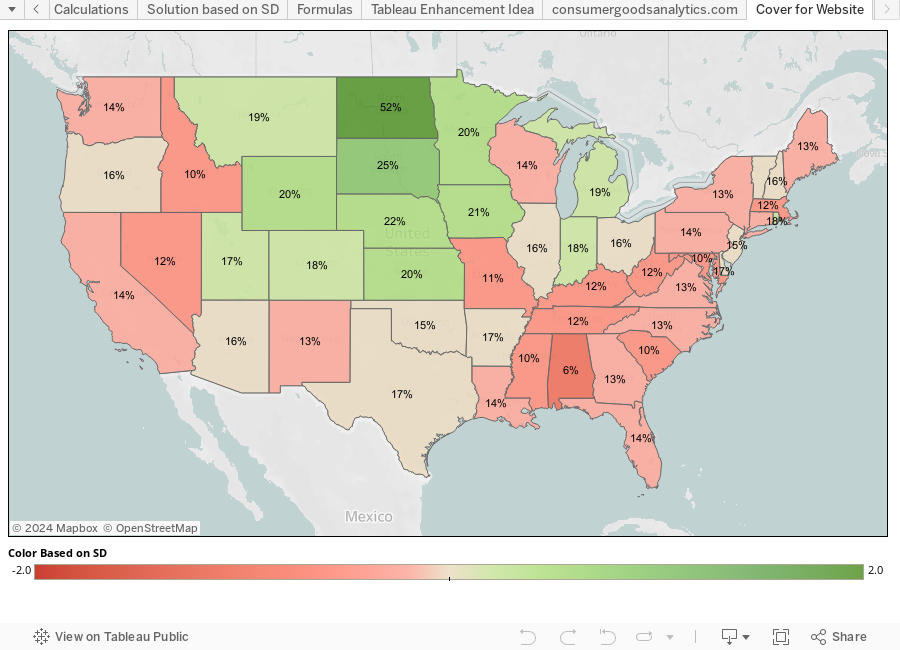
Color That Adapts To Your Data: ConsumerGoodsAnalytics.com can help you enhance Tableau's color mark functionality by changing the default "min-to-max" setting into one that adapts to your specific data to optimize your analysis capabilities.
 The 2012 Tableau Customer Conference was held in San Diego, CA, from November 5-8, at the Hilton San Diego Bayfront Hotel. The conference was attended by 2,200 Tableau customers, and was sold-out this year. There were close to 180 different sessions held during the conference that focused on tracks ranging from “hands-on training” and “Tableau Jedi Analytics Guru” to “Customer success stories” and more.
Tips & Tricks in the Wild Session Details
The “Tips & Tricks in the Wild” session was held on Wednesday, November 7th in the afternoon, and it was so popular it had to be moved to a larger room to accommodate the crowd. ConsumerGoodsAnalytics.com was honored to be among the presenters for this session.

The 4 speakers and topics included:
- Santiago Restrepo, Founder and CEO of Consumer Goods Analytics - Explained how to automatically change the range of colors of a data set by using the standard deviation and mean.
- Alex Blakemore of Apogee Integration LLC - Made a case for how to avoid misleading interpolation in line charts by inserting rows to fill in time gaps.
- Ben Jones, Blogger at Data Remixed - Showcased how to create statistical process control charts in Tableau, with speeding ticket data.
- Kate Treadwell, Interworks' BI Consultant - Demonstrated how to use the program Tabcmd to automate the production and distribution of reports from the Tableau Server.
|
|
 |
|
|
| Video coming soon! |
Tableau Workbook Tableau Reader Required -Free! |
Raw Data |