How to analyze a store test using advanced analytics techniques to identify similar stores, and uncover that the test was indeed very successful.
Background: Store Test
A consumer goods manufacturer or retailer introduced a series of new premium SKUs in some stores to perform a retail test, in order to determine if those new SKUs increased the overall category performance. Some basic methodologies initially suggested that the test was not being successful. However, when the correct analytical approach was implemented, using a similar store concept, the test proved to be successful.
Ingredients: Store Test
(see list of preferred vendors)
- Point of Sale data by store
- A powerful database with the capability to manage huge amounts of data (POS by store, by week, by SKU), or an advanced analytics services company
- Advanced data visualization software to perform the majority of the analysis and share the results
- A statistical software to perform a clustering algorithm
|
|
|


Recipe: Store Test
- Understand the test details
- Exclude closed and new stores
-
Calculate metrics related to store-specific performance
- In this example we looked at the slope, total store sales, and % of high income consumers
- Exclude outliers
- Implement a clustering algorithm to determine similar stores
- Compare the cluster distribution for test stores and the rest of the retail chain
- Select the control stores so you have a basis for comparison during the store test
- Analyze the performance difference between the test and control stores
- If the test is successful, expand the test
Results: Store Test
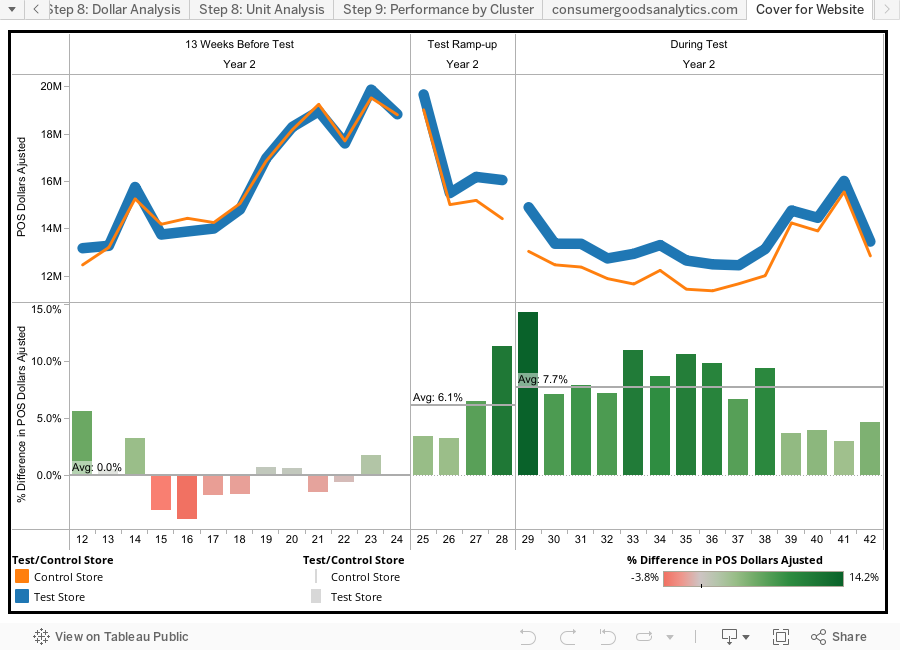
The methodology determined that the test increased price per unit by 5.2%, dollar sales (POS $) by 7.4%, and unit sales (POS Units) by 2%. Most important, it supported the correct decision to expand the test to more retail stores, contrary to the initial basic analysis that suggested that the test was not successful.
Datasets and Files: Store Test
|
Raw data |
Tableau Workbook Tableu Reader Required -Free! |
Detailed Steps: Store Test
- Step 1 – Understand the test details: Create a chart that represents the store test in detail. Ideally it should show the POS by week, for all the different periods, the composition of the whole category (sub-brand base and sub-brand premium in this case), and when the test products were introduced.
- Step 2 –Exclude closed and new stores: Closed and new stores add a lot of noise and churn to the analysis. In order to make it simple and clean, we recommend excluding closed and new stores from the analysis. Counting the number of weeks during each of the periods is an easy way to determine the closed and new stores
- Step 3 – Calculate metrics related to store performance: In order to determine similar stores, we need to understand how the different store perform and behave. We suggest selecting 3-5 key store metrics or characteristics, and calculate them for every store. In this case we calculated the slope, store POS $ and % of high income consumers. Other metrics can be selected based on what makes sense for the test and the category. A few examples of other metrics and characteristics that can be selected are: Store square footage, All Commodity Value (ACV), shelf space, demographic store variables, store segment, etc.
- Step 4 – Exclude Outliers: Outliers affect a clustering algorithm (used in the next step) considerably. We recommend excluding the outliers from the analysis. This visualization is very helpful in determining outliers visually.
- Step 5 – Implement a clustering algorithm: The algorithm groups stores that have similar metrics or characteristics, placing every store into one of the clusters (similar stores). A statistical package is required to implement this step. The number of clusters should provide enough differentiation between them, and have a large number of stores in each cluster. We recommend creating 4-8 clusters. In this case, cluster 1 is composed of stores with small sales, better % of high income consumers and slope close to zero. Each cluster has its own key characteristics.
- Step 6 – Compare the cluster distribution for test stores and the rest of the chain: The composition of the test stores can be very different from the composition of the rest of the chain. In this case, the test stores are highly weighted towards clusters 1 and 2, while the rest of the retail chain has a lot of stores in cluster 4 and 5.
- Step 7 – Select the control stores: These should be selected from the rest of the chain, and should follow the same distribution as the test stores. Since usually there are less test stores than the rest of chain, the control stores should be selected randomly, and the distribution should be the same (same number of stores per cluster)
- Step 8 – Analyze the performance difference between the test and control stores: The visual charts speak for themselves!! The test increased price per unit by 5.2%, dollar sales (POS $) by 7.4%, and unit sales (POS Units) by 2%. The main benefit of this test and control methodology is that it isolates the external factors and minimizes the “noise” in the analysis, therefore providing more realistic results. All the external factors that affected the sales (seasonality, macro-economy, etc) have a similar effect on both the test and control stores, therefore minimizing the potential effect in the analysis.
- Step 9 – If the store test is successful, expand the test: If the results of the test are positive, the test should be expanded to the rest of the chain, or the clusters where it performed better. In this case, the test performed better in clusters 2, 4 and 5 (the lines have a bigger slope/change before and after the test). If the test was not successful, then it should be discontinued.
Cautions: Store Test
The following basic methodologies are commonly used by many analysts, often generating the wrong insights and driving incorrect decisions:
- Basic Methodology 1: Analyzing the sales before and after a test is implemented can drive erroneous conclusions. In this case, performance during the test actually was worse than before. This can be caused by multiple factors like seasonality, macroeconomic indicators, changes in consumer demands, competitor’s actions, etc. The fact that the sales were lower during the test does not mean that the test was unsuccessful.
- Basic Methodology 2: In order to account for seasonality and annual performance adjustments, many of the retail analysis are performed using a year-over-year % change calculation for the test stores. In this case, the performance during the test was actually worse than the performance before. This can be caused by regional performance differences in the test stores, but does not mean that the test was unsuccessful.
- Basic Methodology 3: Another analytical framework for analyzing tests, looks at the performance of the test stores vs. the rest of the chain. This methodology is not accurate, as the store composition of the test stores might be very different than the composition of the whole chain. In this case, the test stores dropped their sales more than the rest of chain, but this does not mean that the test was a failure.
Common Questions: Store Test
-
Q: Why do we adjust the price, POS % and POS Units in the Analysis charts?
- A: The adjustment allows for an easier visualization and quantification of the results, by setting the % between test and control stores, before the test, as zero. In order to eliminate the adjustments, move the adjustment to zero. The results (difference between the test and control, during the test) will be the same, but harder to visualize.
-
Q: Without adjusting the results, why are the test and control lines not closer to each other?
- A: Not every factor or store characteristic can be included in the clustering algorithm and the analysis, therefore the performance of the test and control stores might be different. The important consideration is how the performance changes after the test, and if that performance change is different between the test and control stores.